The Scarlet Sails Timeline
Infographic for Orion-art
Timelines perfectly illustratrate events with several overlapping time layers. The Scarlet Sails multimedia show is a perfect case.

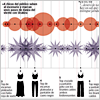
The chart shows all components: fireworks ![]() ,
, ![]()
![]() ,
,![]() ,
,![]() .
.![]() , aquabikers and jet skiers illustrate themselves.
, aquabikers and jet skiers illustrate themselves.
The Scarlet Sails occurs during one of the shortest white night: the sky darkens only for 20 minutes. The chart clearly shows that the performance begins at twilight and ends when it is already dawn ![]() .
.
The chart helps designers to select correct dominant color and prevents composition mistakes. During instalation another chart is used to guide the placement of devices on barges, embankments, the Strelka and walls of the Peter and Paul fortress.